Showing posts with label GDP. Show all posts

Wednesday, July 2, 2025

1H2025 – Markets demonstrated lot of resilience and character

 1H2025 was marked by stressful events, high volatility, and uncertainty. In geopolitics, several conventions were breached and new doctrines established. The war between Russia and Ukraine continued. India and Pakistan had a brief but intense conflict. The US entered the Middle East (Israel-Palestine) conflict by attacking Iran.

Climate wise, India had a mild winter followed by a mild summer, impacting crops. Europe continued to witness warmer weather, while the US, Canada, UK, Korea and several other countries in Africa witnessed intense and widespread wildfires, causing immense damage to the climate, lives of people and economy.

Politically, the US witnessed one of the most boisterous power transitions with Donald Trump taking over as the President (POTUS). He started his second term in the White House with radical changes in immigration, trade, and climate change policies. This put the US administration on the path to confrontations with citizens, judiciary, major trade allies (e.g., Japan, EU and China), strategic partners (E.g., Mexico, GCC, Canada and India). Towards the end of 1H2025, however things appear somewhat calming and progressing towards sustainable resolutions. The process of developing a new world order based on new ground realities and future prospects took a few more strides.

Technologically, Artificial Intelligence (AI) entered the lives of common men with Google and X (Formerly twitter) launching their user-friendly models. China launched DeepSeek to compete with ChatGPT (Open AI) and most social media platforms, search engines, financial and other services providers, integrating some sort of AI interface for the users.

Markets were volatile as the forces of hope and fear took turns to dominate the participants’ sentiments. In the end, the forces of hope appear to have emerged stronger. Most markets have recovered their losses and are progressing well on the path to growth.

In India, the economic growth returned to the normal pre-Covid trajectory, as the base effect of FY20 and FY21 low growth tapered off, and external challenges mounted. Equity markets settled close to their all-time high levels recorded in 3Q2024.

The following are some of the highlights of the performance during FY25.

Equity Markets

The Indian equity market managed to end 1H2025 with strong gains, despite yielding negative returns for three out of the six months. Indian equities performed in line with the European and US equities. The benchmark Nifty yielded a return of ~8% (9% in USD terms), which was better than the US markets (S&P500 +6%), Japan (Nikkei +1%) and Europe (Stoxx600 +7%) but much lower than South Korea (KOSPI +20%), Brazil (BOVESPA +14%) and Germany (DAX +20%). The valuation premium of Indian markets to the other emerging markets therefore remained elevated.

Financials saved the day for Indian benchmark indices

The benchmark Nifty (+8%) sharply outperformed broader markets (NSE500 +5.5%, Midcap Nifty 100 4.4%, Smallcap Nifty 100 +1.6%). The gains in benchmark indices were mostly led by banks (Nifty Bank +12.7%). Overall market cap of NSE was higher by 4.6%.

Sector-wise, Financials, Private Banks, Infra were top outperformers. IT Services, Realty, Pharma, FMCG, Energy were notable underperformers. Micro-sector-wise, Defense, Capital Markets, Healthcare, Fertilizers were outstanding. Renewable energy and real estate builders were notable losers.

1H2025 witnessed 3/6 negative months

The benchmark Nifty50 yielded negative month-on-month (MoM) returns for three out of six months in 1H2025. April was one of the best months ever for Nifty, yielding a gain of 16% MoM. The market breadth was negative in three out of six months implying much higher volatility in the broader markets.

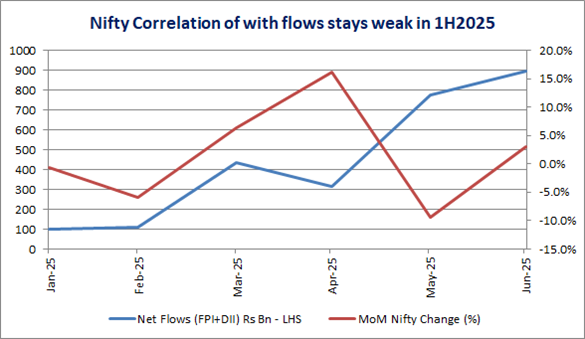
Institutional flows positive

Over institutional flows were materially positive for 1H2025. Net domestic and foreign flows in the secondary equity market amounted to Rs2630bn. Foreign Portfolio Investors (FPIs) were however net sellers of Rs945.36bn in the secondary market, while domestic institutions pumped in Rs3575.75bn. On an encouraging note, FPIs were net buyers in the last four months of 1H2025. The nifty-institutional flow correlation was very weak in 1H2025.

Debt and Currency Markets

Indian debt and currency markets were volatile in tandem with the global trend. The benchmark bonds managed to close 1H2025 with decent gains, the long-dated bonds were lower. USDINR ended almost unchanged, but EURINR, JPYINR and GBPINR were materially weaker.

RBI cut the policy rates by 100bps and Cash Reserve Ratio for commercial banks also by 100bps during 1H2025. The benchmark 10-year treasury bond yields eased to 6.31% from 6.80% at the beginning of the year. Lending and term deposit rates were lower by up to 10-25bps. The yield steepened sharply.

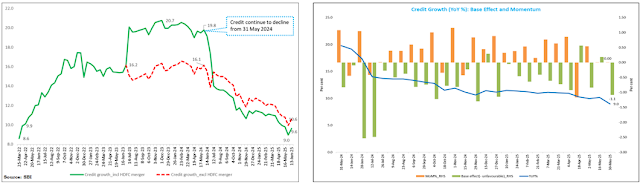
The RBI maintained its policy stance to “neutral”. The liquidity position remained comfortable with RBI conducting OMOs to keep the system liquidity in surplus. The credit growth continued to decline; however, there are signs of corporate credit demand picking up. Overnight and call money rates cooled ~50bps.

Economic conditions

4QFY25 GDP growth (+7.4% yoy) came sharply higher than the estimates. The consensus estimates for FY26E GDP growth however remain pivoted to ~6.5%. CPI Inflation mostly remained within the RBI’s tolerance band of 4-6% and has recently breached on the lower side. Core inflation has also eased. Real rates have mostly remained in positive territory during 1H2025. Fiscal deficit continued to decline. The private sector investments failed to gather the desired pace, despite several government incentives. The government capex showed some improvement in 1H2025. External conditions remained stable during 1H2025 despite geopolitical conditions remaining volatile. Lower trade helped the current account balance. However, BoP was briefly negative. RBI replenished most of its USD reserves, expended to support USDINR earlier in the year.

Commodities

1H2025 was a mixed period for commodities. Precious metals (Gold +26%, Silver 23%) and Copper +12.8, recorded good gains, while energy (Brent Crude -11%, Coal -12%), other metals (Steel -10%, Zing -8%) and soft commodities (Sugar -16%, Corn -11%) ended the period with strong losses.

Crypto shine

Cryptocurrencies further strengthened their position with material rise in trading volumes and market capitalization. Bitcoin ended the period 1H2025 with a strong 14% gain. More jurisdictions accepted cryptocurrencies as a valid medium of exchange, financial asset and/or tradeable asset.


Wednesday, June 25, 2025

Strategy for Viksit Bharat @2047

 The Niti Aayog published a working paper titled “India’s Path to Global Leadership: Strategic Imperatives for Viksit Bharat @2047”, in April 2025. The paper presents a roadmap for India’s economic growth, encompassing sustainability, social inclusion, national security, and global leadership.

Wednesday, June 11, 2025

The Indian economy – disconnect in growth statistics

 While the 7.4% GDP growth number for 4QFY25, and claims of continuing strong growth momentum in April 2025 are encouraging, the RBI assessment of FY26 growth and aggressive policy stance raise some doubts. A careful analysis of the GDP data released by the NSO also leaves some doubts about the consistency and sustainability of the 4QFY25 growth numbers.

Many economists have noted discrepancies and incongruencies in the data, as well as comparisons with other economic indicators and external analyses.

For example, I found the following noteworthy.

Discrepancy Between GDP and GVA Growth Rates

In Q4 FY25, GDP growth is 7.4%, while GVA growth is 6.8%. The divergence between GDP and GVA growth rates is notable, as GDP includes net taxes (taxes minus subsidies), which can distort the picture of underlying economic activity captured by GVA.

The gap suggests that tax revenues or subsidy adjustments may have inflated GDP growth relative to GVA. For instance, higher GST collections or reduced subsidies might have boosted GDP figures without reflecting proportional growth in actual economic output. This discrepancy raises questions about the sustainability of growth driven by fiscal adjustments rather than core sectoral performance.

As per Systematix research, “Recent robust GST collections have been interpreted as evidence of strong economic growth, supporting the 4QFY25 real GDP growth of 7.4%. However, this narrative contrasts with on-ground economic indicators suggesting a demand slowdown. Our analysis reveals that rising GST collections stem not from stronger economic growth but from increased indirect tax incidence in a slowing economy. This trend aligns with the government’s pro-cyclical fiscal tightening framework over recent years. We estimate an excess tax collection of INR 2.9 trillion over the past two years (2QFY24–1QFY26E), which has elevated the net indirect tax burden on Indian households to a historical peak. This has suppressed household spending power, exacerbating the lack of real income growth.”

Q2 FY25 Growth Slowdown vs. Q4 Recovery

2QFY25 reported a seven-quarter low GDP growth of 5.4%. 1QFY25 growth slowdown could be explained by the spending restrictions due to the imposition of the model code of conduct during the general elections (March-June 2025). Logically, 2QFY25 should have witnessed excessive government spending due to spillover effects from the previous quarter.

The rapid recovery from 5.4% in Q2 to 7.4% in Q4 appears inconsistent with the broader FY25 growth of 6.5%, suggesting uneven economic momentum. The low Q2 growth was attributed to reduced government spending and weak private investment, but the factors driving the Q4 rebound (e.g., manufacturing and construction) are not fully explained in the press release.

Sectoral Growth Inconsistencies

Agriculture (3.8% in FY25)

The agriculture sector’s growth improved significantly from 1.4% in FY24 to 3.8% in FY25, attributed to a good monsoon. However, this contrasts with reports of uneven monsoon distribution and challenges like low reservoir levels in some regions, which could have limited agricultural output in certain areas.

The uniform 3.8% growth figure may mask regional variations or overstate the sector’s recovery, especially since agricultural income growth (e.g., farm wages) has not kept pace, as noted in some external analyses.

Manufacturing (5.0% in FY25)

Manufacturing growth slowed sharply from 9.9% in FY24 to 5.0% in FY25, yet Q4 FY25 GDP growth (7.4%) suggests a manufacturing rebound. This is inconsistent with high-frequency indicators like the Index of Industrial Production (IIP), which showed subdued industrial activity in most parts of FY25.

The slowdown aligns with high input costs and weak export demand, but the Q4 recovery lacks detailed sectoral data to confirm whether manufacturing truly drove the uptick or if other factors (e.g., statistical adjustments) played a role.

Construction (9.4% in FY25)

Construction grew at 9.4%, down slightly from 10.4% in FY24, yet government capital expenditure reportedly slowed in FY25. This raises questions about the source of growth, as public infrastructure spending is a key driver of construction.

Private sector construction (e.g., real estate) may have contributed, but the press release does not disaggregate public vs. private contributions, creating ambiguity.

Expenditure-Side Discrepancies

Private Final Consumption Expenditure (PFCE) grew at 7.2% in FY25 (up from 5.6% in FY24), indicating strong household spending. However, this contrasts with external reports of weak rural demand and urban consumption slowdowns, particularly in discretionary goods (e.g., automobiles, FMCG).

The robust PFCE growth may be driven by urban or high-income consumption, but the lack of granular data obscures whether this reflects broad-based demand or is skewed by specific segments.

Government Final Consumption Expenditure (GFCE) growth slowed to 2.3% in FY25 from 8.1% in FY24, reflecting fiscal consolidation. However, the strong Q4 GDP growth (7.4%) and high growth in public administration (7.8%) suggest continued government spending in certain areas, creating a potential mismatch.

The low GFCE growth may understate government contributions in Q4, or the sectoral growth in public administration may reflect non-expenditure factors (e.g., statistical adjustments).

Gross Fixed Capital Formation (GFCF) growth slowed to 7.1% in FY25 from 8.8% in FY24, indicating weaker investment. This aligns with reports of sluggish private investment but contrasts with the strong construction sector growth (9.4%), which typically relies on capital investment.

The disconnect suggests that construction growth may be driven by specific sub-sectors (e.g., real estate) rather than broad investment, but the press release lacks clarity on this.

Mismatch with High-Frequency Indicators

The GDP growth of 6.5% for FY25 and 7.4% for Q4 FY25 appears optimistic compared to high-frequency indicators like-

Index of Industrial Production (IIP): Showed weaker industrial growth, particularly in manufacturing, contradicting the Q4 rebound.

Purchasing Managers’ Index (PMI): Indicated slower manufacturing and services activity in parts of FY25.

Core Sector Output: The eight core industries (e.g., coal, steel, cement) showed subdued growth in some quarters, inconsistent with the strong construction and manufacturing contributions in Q4.

These indicators suggest a more sluggish economy than the NSO’s GDP figures imply, raising concerns about potential overestimation or statistical discrepancies in the GDP calculations.


Comparison with External Forecasts

The NSO’s FY25 GDP growth estimate of 6.5% is lower than the Reserve Bank of India’s (RBI) revised forecast of 6.6% (down from 7.2%) but higher than some private forecasts (e.g., 6.0–6.3% by agencies like ICRA or SBI). The Q4 growth of 7.4% also exceeds many analysts’ expectations (e.g., 6.8% median estimate).

The higher-than-expected Q4 growth and the annual estimate suggest either a stronger-than-anticipated recovery or potential overestimation in the NSO’s provisional data. The reliance on provisional estimates, which are subject to revision, adds uncertainty.

Other disconnects

There are some other disconnects in the GDP data. For example, the nominal growth in 4QFY25 at 10.8%, much ahead of money supply growth of 9.6% is fully explained. A growing economy would usually need higher money supply due to higher transaction demand. This mismatch can probably be explained by the use of an erroneous deflator. Besides, external trade data, sharp contraction in subsidy payments etc. also raise some doubts.

Also read

The state of the Indian economy

The Indian economy – glass half full

The Indian economy – glass half empty

RBI makes a bold bet

Thursday, June 5, 2025

The Indian economy – glass half empty

The Indian economy has indubitably shown brilliant resilience and sustained the base growth rate of ~6%. In the current year FY26 also the real GDP is expected to grow in the range of 6.3% to 6.6% (vs 6.5% in FY25).

Wednesday, June 4, 2025

The Indian economy – glass half full